Knowledge graph insights
Top merchants, spending by category, items bought together, anomalies and recommendations.
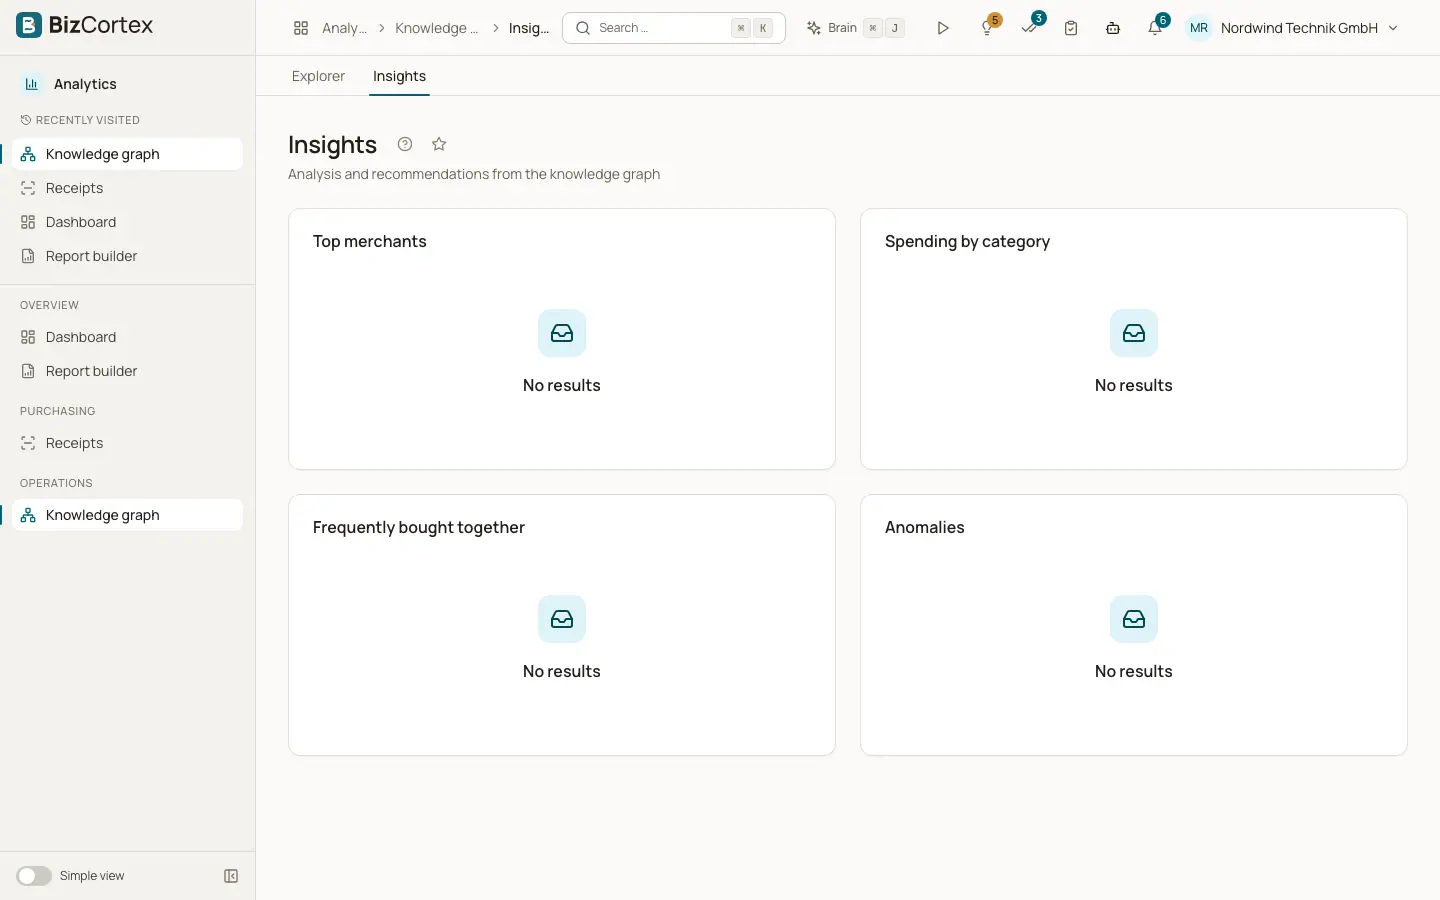
Open Analytics, "Knowledge graph", "Insights". The page analyses your receipts and the knowledge graph and shows the results in cards.
Who can use this
- Owner
- Admin
- Accountant
- Viewer
Fields and options
- Recommendations
Shown at the top when available. Today BizCortex suggests bulk buying for products you bought more than 5 times. Each card shows a "Confidence" in percent, from 80% up to at most 95%, rising with the number of purchases.
- Top merchants
The 10 merchants that appear most often in your receipts.
- Spending by category
The sum of all line items per category. Items without a category are grouped as "Uncategorized".
- Frequently bought together
Up to 10 pairs of products that most often appear on the same receipt.
- Anomalies
Possible duplicate receipts (same merchant, same date and same total) and receipts whose line items do not add up to the subtotal (difference larger than 0.05).
Tips
- Check anomalies regularly. A duplicate receipt can lead to an expense being booked twice.
Good to know
- The insights are calculated each time you open the page. There is no button to rebuild the graph.
Related
- Knowledge graph explorer
Explore the network of merchants, products, categories and payment methods found in your receipts.